Visit Us

Membership

Classes

Facilities

Events

Blog

About Us

Submit Your Art

Our Blog. Get inspired, get involved, get moving.

Sign up for our weekly email newsletter here and "like" us on Facebook here

Entries in Infographic (3)

Wednesday
May022012

Infographic: NYCEDC Compares New York Real Estate And Art Sales


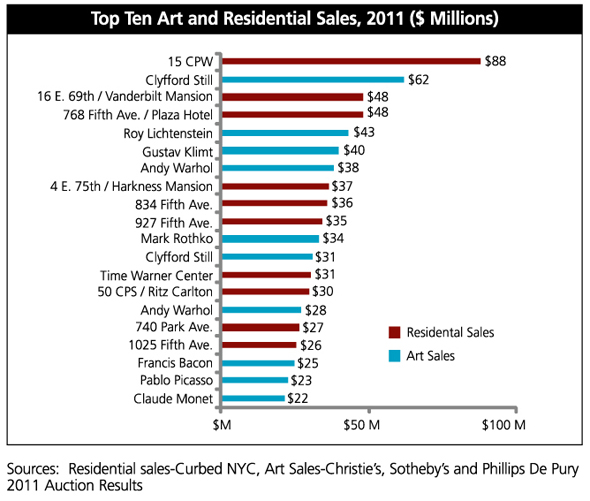
When it comes to art and residential real estate, it's not surprising that New York is home to many eye-popping sales in both markets. Though this chart from NYCEDC's February 2012 Economic Snapshot shows just how evenly those numbers match up side-by-side.

For instance, if you emptied your piggy bank last year and discovered that you had saved up around $40 million, you could have acquired Gustav Klimt's "Litzlberg am Attersee," which sold at Sotheby's for $40.44 million, or Andy Warhol's first self portrait, which went for $38.4 million at Christie's. If you were more in the mood for a new pad rather than a masterpiece, you could have set yourself up in the Harkness Mansion or 834 Fifth Avenue with a few mil to spare!

For a more a closer look at these findings, check out this NYCEDC's podcast featuring 3rd Ward writing teacher Grace Bello and Steven Giachetti of NYCEDC's Research and Analysis team. "If you look at it on a per square foot basis, obviously art is far more expensive than even the most prestigious apartments in New York City," Giaccetti says.

Here are a few other fascinating statistics from that snapshot:

  • New York accounted for about one third of all global sales at Christie's and Sotheby's in 2011.
  • NYC is also home to more than half of all art sales in the United States.
  • Local auction houses Christie's, Sotheby's and Phillips De Pury racked up a whopping $1.1 billion in sales of contemporary and impressionist art in just two weeks last November.

-- John Ruscher

Thursday
Feb162012

Infographic: How Photographers Actually Spend Their Time

If you've spent even 30 seconds hanging out on any social network in the past few days, chances are high you've bumped into a few different versions of a new Internet meme in which different professions are given the "What ______ think I do" treatment. For instance, here are ones about graphic designers and directors, the latter of which seems to have started the trend. There's also one about photographers, but since we're much bigger fans of fascinating, informative charts than crudely designed jpegs, we'd like to share the chart below, which compares how people think shutterbugs spend their time with the actual nitty gritty specifics of a career in pro photography.

When we first came across the chart, we thought its numbers might fall into that infamous 73% of statistics that are made up on the spot, but after a little research we discovered that they are actually the results of a survey conducted by the International Society of Professional Wedding Photographers. Whether they shoot weddings or not, we think the chart provides a thought-provoking contrast between the realities of editing, office work and marketing and the preconception of photographers as leading lives of endless glamour, traveling and creativity.

Next time you're out at an event and spot that photog snapping away on her DSLR, you can still be jealous, but don't forget the other hard work that goes on after the party is over.

-- John Ruscher

Friday
Dec022011

INFOGRAPHIC // The Future of Money In The New Economy

We're always excited to come across some good chart porn, but we particularly love this infographic, as it addresses many of the innovative ideas and emerging systems that we champion here at 3rd Ward. 

Put together by the Emergence Collective, a collaborative platform started by Berlin-based creative studio KS12The Future of Money aggregates "research on emerging marketplaces, platforms, tools, initiatives and opportunities for the new economy," including coworking, resource and knowledge sharing, exchange platforms, open innovation and more.

Click image to enlarge or click here for a PDF.

After the jump we've highlighted examples of a few of the different initiatives featured in the infographic so you can explore them on your own.

Barter Networks: Swap.com - A global swap marketplace.

Co-Production: Open Design City - A collaboration space that "encourages the sharing of tools, knowledge, ideas and skills."

Crowdfunding: Cofundit.com - A website that connects people looking to finance projects with potential investors.

Crowdsourcing: Mechanical Turk - An Amazon.com company that lets businesses and developers utilize a workforce of any size while at the same time letting workers earn money by working on HITs (human intelligence tasks) anywhere, anytime.

Digital Currencies: Bitcoin - An open source currency system that uses peer-to-peer technology to facilitate instant payments.

Group Buying: 1bog.org - A website that helps users to reduce the cost of green home improvements by purchasing products as a group.

Open Innovation: One Billion Minds - A website that allows you to launch a challenge that others can help solve or lend your knowledge and skill to solve someone else's challenge.

-- John Ruscher